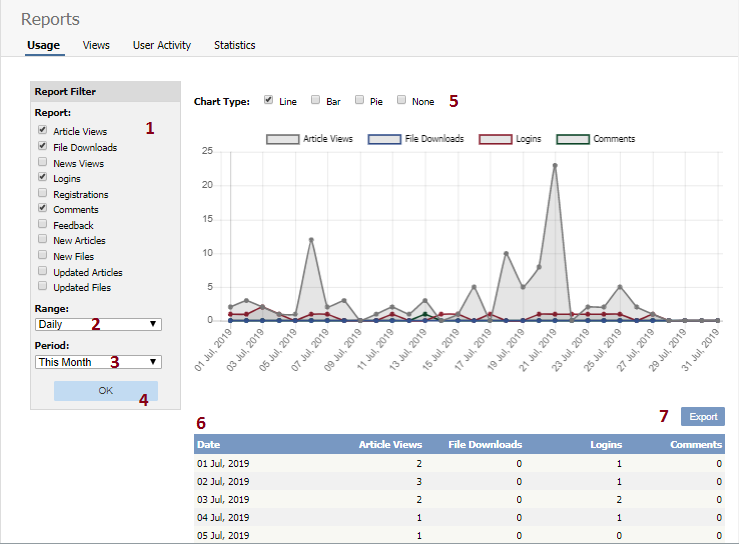
- Report Filter allows you to choose which statistics you want to report on. Check each item you want statistics for
- Range allows you to determine whether the stats are shown for each day, for a month at a time or for a whole year.
- Period is the time period over which the stats are to be listed for. The options here depend on what you choose in the range. For example, if you choose monthly, then the period options will be this week, previous week, this month or the previous month.
You can also select a custom period. If you choose this KBPublisher allows you to choose a From date and a To date. - Once you have selected filters, a range and a time period, click the OK button to produce the report.
- The report is displayed as a graph – you can choose line, bar or pie charts
- And as a table on screen.
- If you wish, you can also Export the results.
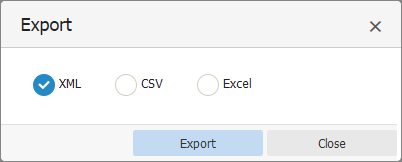
If you click on the Export button, you get the option to export the results in XML, CSV or Excel format. Once you have chosen the appropriate format to export in, click on the Export button to export the data. You will be asked if you want to open the file or save it.
Note:
- Report functionality only works when scheduled tasks are turned on
- Data collected is summary data. We do not break down data to individual user level, we collect totals only.
----------------------------------------------------------------------
This functionality works in version 3.5 and above