|
|
Article ID: 403
Last updated: 30 Jul, 2019
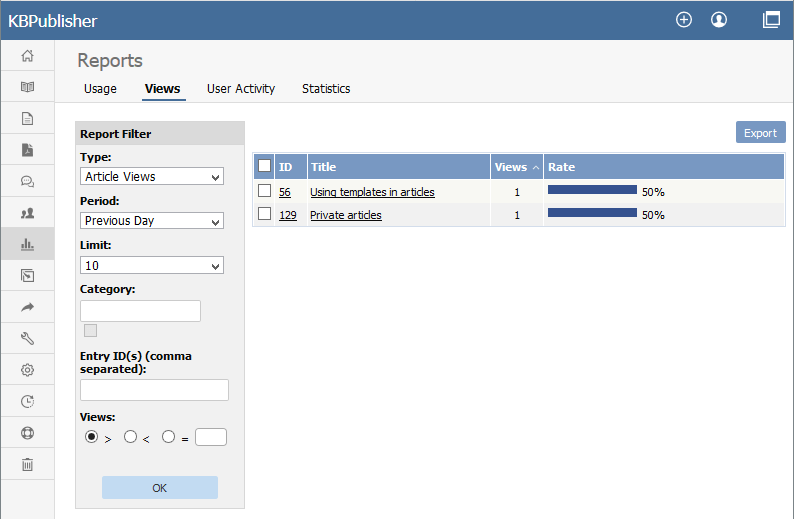
The Views Report lets you review how often visitors are looking at each of your articles or documents.
The main display shows you, for each document:
If there are a lot of entries, the list at the right is broken up into pages, with the number of entries displayed at the top left. Use the navigation options at the top right to move through the list. You can filter the display to simplify finding what you want. The Report Filter is on the left of the screen, and you can use one or all of these filter conditions:
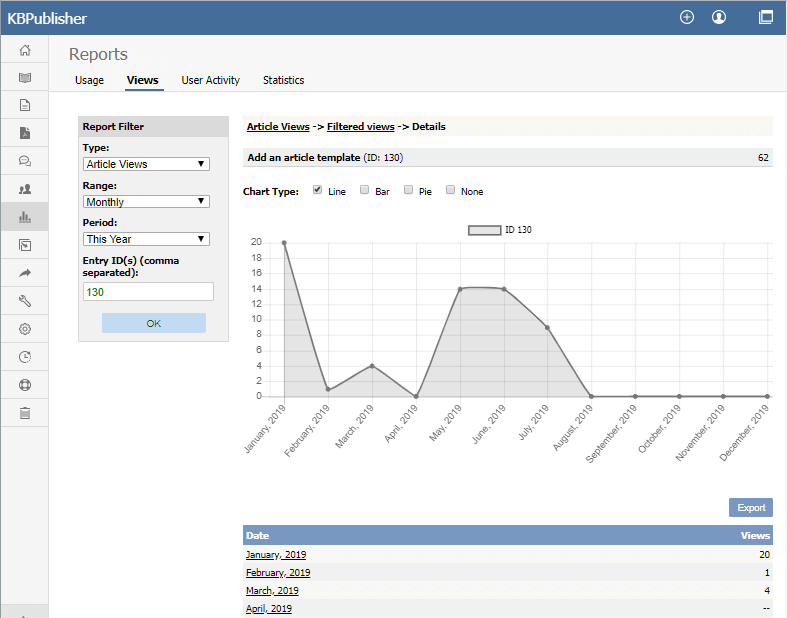
Click OK to display filtered search results. If there are no results, your search may be too restrictive: remove or relax one filter and click OK again. To see details about one document use, you can click its title. The Details appears. This view has a space for a chart at the top, a table and an export button. Details ViewThe details view can display a chart of document use, and has a table to report on daily use and a button to export the information.
Chart A chart of document views can help you analyze viewing and use patterns over time. You can display the information about the selected document or documents as a Line, Bar, or Pie chart; or you can opt to have no chart: Table The table shows the number of views for the selected document for each day in the selected period. Sundays appear in red so you can quickly see week-by-week information. Export button You can export the views data for the documents you selected. See Export Reports.
Note: Report functionality only works when scheduled tasks are turned on
Article ID: 403
Last updated: 30 Jul, 2019
Revision: 3
Access:
Public
Views: 1671
Comments: 0
|

Powered by KBPublisher (Knowledge base software)